Women Height chart in cms for Seniors 90 years old
General Summary: 90 year old women height
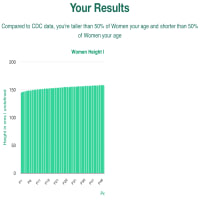
In most cases, height measurements for 90 year old women will be in the range between 147 and 171 cms. The average height for 90 year old women is 160 cms, according to the CDC and anonymized data from users.All Results
Enter your height measurements above to see how they compare
So far, we have recorded 0 height measurements for 90-year-old women on LifeMeasure!
(chart updates daily)
Height chart for 90-Year-Old women
Growth patterns for older women: how height typically progresses at 90-Year-Old.
Height percentiles for 90-Year-Old women
The height distribution for older women at 90-Year-Old, based on CDC growth standards:
5th percentile: 144.4 cm
25th percentile: 150.5 cm
50th percentile (median): 154.8 cm
75th percentile: 158.9 cm
95th percentile: 165.7 cm
The percentile values on this page are displayed in cm.
A percentile shows how your measurement compares with older women of the same age and sex. Being at the 50th percentile means exactly half of older women measure more and half measure less.
Height and development for older women
At 90, height measurement reflects decades of cumulative bone and disc changes. Height loss of 5-8 cm or more from peak adult height is not uncommon in people in their seventies, eighties, and nineties. Managing the health conditions that accelerate this process - particularly osteoporosis and vitamin D deficiency - helps preserve functional independence.
Managing height loss in later life
At this life stage, the priorities are maintaining functional height through spinal health, managing osteoporosis if present, and preventing falls that can cause vertebral fractures. Annual measurement of height provides a simple way to monitor cumulative bone and disc changes.
When to seek a bone density review
A reduction of more than 4 cm from peak adult height is associated with increased vertebral fracture risk and warrants bone density assessment. A GP or geriatrician can assess whether current bone health management - including calcium, vitamin D, and any prescribed medications - is appropriate for individual circumstances.
Frequently asked questions
Why do older adults lose height?
Height loss in older adulthood is caused by the compression and thinning of intervertebral discs over time, reduced bone density (particularly osteoporosis), and changes in spinal curvature including kyphosis (forward rounding of the upper back). The total cumulative height loss between peak adulthood and age 80 is typically 3-6 cm for women and slightly less for men.
How can I maintain my height as I age?
The most evidence-based strategies for minimising height loss are maintaining bone density through regular weight-bearing exercise, ensuring adequate calcium and vitamin D intake, not smoking (which accelerates bone loss), treating osteoporosis if present, and practising postural exercises such as yoga or Pilates that strengthen the back extensors and deep core muscles.
Does height change after age 25?
Adult height is essentially fixed from the mid-twenties. Very gradual height loss begins in the forties due to compression of intervertebral discs and changes in spinal posture, amounting to about 1 cm per decade initially and accelerating slightly after 60. Maintaining bone density through exercise and adequate calcium reduces this loss.
Data sources and methodology
The percentile ranges on this page are drawn from CDC National Health and Nutrition Examination Survey (NHANES) data, Vital and Health Statistics Series 3 Number 46 (2021-2023 release), and CDC Body Measurements FastStats. Percentiles are modelled using the LMS method (Box-Cox transformation), which accounts for the skewed distribution of measurements at each age. All measurements are given in metric units with imperial equivalents.
Individual variation is normal and expected. A healthcare provider can help interpret these measurements in context with overall health and development.
See more ages